Tom Chen, Engineer at Product R&D Division of CoreTech System (Moldex3D)
Design of experiment, DOE
The final quality of injection molded products is related to multiple factors such as product design, mold design, material properties, and molding conditions; changes in each factor may affect product quality. Using the traditional trial-and-error method to evaluate each factor is both costly and inefficient. To effectively find the key factors, solve molding problems, and optimize product quality, it is necessary to adopt the design of experiment (DOE) approach. With DOE, we can study how each factor affects the quality and the relations between them to determine the optimized design.
Take coffee as an example. The taste of coffee can be affected by the degree of roasting (light to dark), the degree of dehydration (low to high), the soaking time (short to long), the soaking temperature (low to high), etc. It is time-consuming to experiment by changing each variable respectively. If changing more than two variables at a time, we are not able to evaluate which factor has more impact on the experiment. In injection molding, factors including melt flow rate, melting temperature, melt pressure in the cavity, and cooling rate can affect the warpage results. Under the influence of so many factors, adopting the trial-and-error method is not a desirable choice. That is why DOE is important.
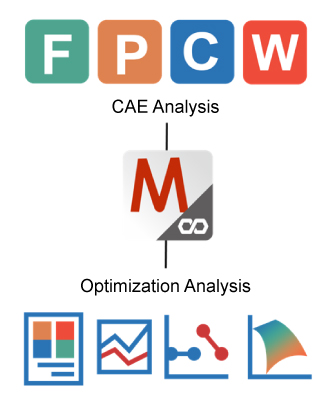
In addition to practical application, DOE can be used with CAE software. The optimization software provides different DOE approaches and can obtain the best solutions through CAE molding simulations. Communication between the two can be established to perform the job iteration. With Moldex3D Studio, molding simulation and optimization analysis can perform simultaneously on a single platform (Fig. 1), bringing us a scientific DOE mold tryout process. The following illustrates how to determine the optimal design in DOE and the assistance from the software.

Fig. 1 With Moldex3D Studio, molding simulation and optimization analysis can perform simultaneously on a single platform.
How to determine the optimal design
In DOE, the control factor and quality factor are the most important. The quality factor is usually the issue that is to be solved or improved; the control factors are the variables in the experiment. The major issues are to evaluate whether each control factor is the key factor and its optimal level. For the coffee example mentioned above, the taste of the coffee can be set as the quality factor; the control factors are the 4 factors mentioned previously, each of which has two levels. DOE is used to find which factor has the largest impact on the taste of the coffee.
Moldex3D provides the Taguchi method and the full-factor experiment method. The differences between the two methods are that the Taguchi method uses an orthogonal array to collect data and only the experiments in the orthogonal array are analyzed, while the full factor method carries out experiments with all possible combinations of all control factors. If the full-factor experiment method is used, the number of experiments is large and will increase time cost, but the results considering all factors can be obtained. Taking the coffee example above, if the full-factor experiment method is used, all 16 (24) combinations will be tested. If the Taguchi method is used, only the 8 (or 12) combinations listed in the orthogonal array L8 (or L12) will be tested (Table 1), and reliable results can be obtained.
Â
| Experiment 1 |
A1 |
B1 |
C1 |
D1 |
| Experiment 2 |
A1 |
B1 |
C2 |
D2 |
| Experiment 3 |
A1 |
B2 |
C1 |
D2 |
| Experiment 4 |
A1 |
B2 |
C2 |
D1 |
| Experiment 5 |
A2 |
B1 |
C1 |
D2 |
| Experiment 6 |
A2 |
B1 |
C2 |
D1 |
| Experiment 7 |
A2 |
B2 |
C1 |
D1 |
| Experiment 8 |
A2 |
B2 |
C2 |
D2 |
Table 1 L8 Taguchi orthogonal array with 4 control factors
Â
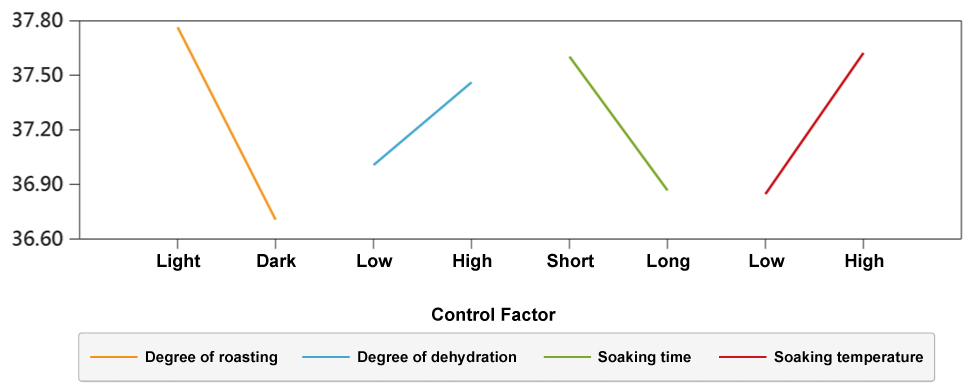
The signal-to-noise ratio (S/N Ratio) was originally an important measure in the field of electronic communication and is now widely used in statistics. In the CAE simulation of DOE, it should be noted that the simulation results under the same settings are the same each time. Without considering other external factors (noise), there is no need to average multiple analyses. Even though it is slightly different from the original standard algorithm of the S/N ratio, its concept can still be applied in molding analysis to compare the impact of control factors on quality factors at different levels. The goals of quality factors may be set as smaller, larger, nominal, or uniform. Applying different formulas to calculate the S/N Ratio, a larger S/N Ratio means that the signal is stronger than the background noise, which is an ideal level. For the coffee example, the quality factor should be “largerâ€. After calculating the average S/N ratio of each control factor at the same level (Table 2 and Fig. 2), we can determine whether the coffee tastes good or not. The major key factor is the degree of roasting, as it has the most drastic effect. The best combination is light roasting, a high degree of dehydration, short soaking time, and high soaking temperature.
| Â |
Degree of roasting |
Degree of dehydration |
Soaking time |
Soaking temperature |
Score of coffee |
S/N Ratio |
| Experiment 1 |
Light |
Low |
Short |
Low |
80 |
38.06179974 |
| Experiment 2 |
Light |
Low |
Long |
High |
70 |
36.9019608 |
| Experiment 3 |
Light |
High |
Short |
High |
85 |
38.58837851 |
| Experiment 4 |
Light |
High |
Long |
Low |
75 |
37.50122527 |
| Experiment 5 |
Dark |
Low |
Short |
High |
75 |
37.50122527 |
| Experiment 6 |
Dark |
Low |
Long |
Low |
60 |
35.56302501 |
| Experiment 7 |
Dark |
High |
Short |
Low |
65 |
36.25826713 |
| Experiment 8 |
Dark |
High |
Long |
High |
75 |
37.50122527 |
Table 2 Â The experimental data and S/N ratio

Fig. 2 The S/N ratio response graph
Â
This method can be applied to multiple quality factors. By setting the weighting of each quality factor, we can calculate the weighted average S/N ratio under multiple quality factors to determine the optimal level of each control factor.
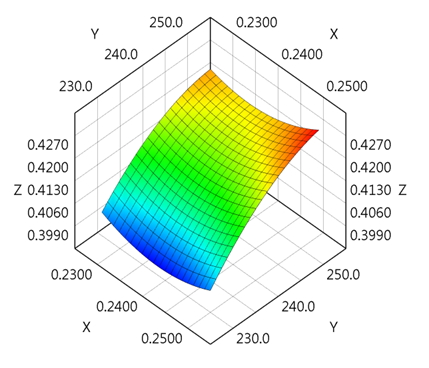
The response surface is a mathematical model for studying the relationship between each independent variable and the response variables. With this model, the second-order or first-order fitting model can be calculated by applying the experimental data to the least square estimation (LSE). This surface can be used as an experimental prediction model without simulation (as shown in Fig. 4). For example, in the coffee experiment above, if the levels are clear values, such as the soaking time of 1 minute and 2 minutes, then the response surface can be derived to predict the coffee score that can be obtained with a soaking time of 1.5 minutes.
Back to the warpage issue mentioned at the beginning, the following will illustrate how to use DOE in Moldex3D Studio to solve problems.
Â
How to solve problems with Moldex3D Studio
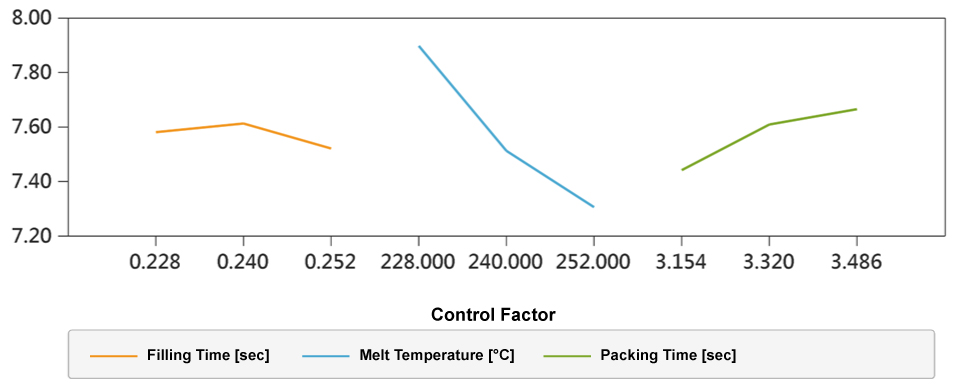
Then, how can we improve the warpage? We can set the total displacement as a quality factor, select variables, such as filling time, melt temperature, and packing time, and set them as control factors. Then, set the levels and select the orthogonal array, and the experiment can be conducted. In practice, in addition to using the molding conditions as variables, we perform DOE for mold and product designs. In CAE, we can use the mesh file as the control factor. Apart from the optimization of the overall physical quantities, local optimization and measurement condition are also common issues. These can all be achieved through the result items in Moldex3D Studio and the results from the tools such as probe and measurement with settings in the DOE Wizard. After the analysis and post-processing in the software, the above-mentioned results will be displayed in different ways, in which users can find their required information. For example, from the DOE results in Fig. 3, we can tell the warpage is most affected by the melt temperature. The optimal design then is a filling time of 0.24 seconds, melt temperature of 228 °C, and a packing time of 3.486 seconds.

Fig. 3 The S/N ratio response graph of warpage
Â

Fig. 4 Through response surface calculations, the experiments can be predicted.
Conclusions
DOE can not only help to quickly find the best design but also find solutions to relevant questions, such as identifying key factors with high effects. Integrating molding simulation software and optimization software can help CAE users to solve their problems more efficiently.
Polyethylene Glycol
Polyethylene Glycol,Polyethylene Glygcol,Poly Ethylene Glycol,Polyethylene Glycol Series
Jiangsu Zhongluman New Material Technology Co., Ltd , https://www.zjrozhmch.com


